Crypto Chaos: Shiba Inu Base, XRP Breakout Odds, and Ethereum’s $3,500 Test
Crypto Market Under the Microscope: Shiba Inu’s Base, XRP’s Breakout Odds, and Ethereum’s Critical Test
The cryptocurrency market is grappling with uncertainty as Bitcoin’s inability to rebound continues to cast a shadow over altcoins. Today, we’re zeroing in on Shiba Inu (SHIB), XRP, and Ethereum (ETH), dissecting their price action, technical patterns, and the broader forces at play. Are these coins poised for recovery, or are we staring down more pain? Let’s break it down with no fluff and no false promises.
- Shiba Inu (SHIB): Hovering at $0.0000099, showing a potential triple-bottom pattern near $0.000010 support.
- XRP: At $2.38, caught in a narrowing triangle with a possible $3 target—or a drop to $2.00.
- Ethereum (ETH): Trading at $3,880, facing a pivotal $3,500 support after failing to hold $4,000.
Why This Matters: Altcoins in Bitcoin’s Shadow
Before we dig into the specifics, let’s set the stage. Bitcoin, the heavyweight that often dictates market sentiment, is stuck in a rut. Its failure to recover from recent lows—partly due to macroeconomic pressures like persistent high interest rates signaled by the Federal Reserve—has left institutional investors hesitant to inject fresh capital. This stagnation ripples through the market, dragging down altcoins like SHIB, XRP, and ETH. With Bitcoin’s dominance hovering high, the question looms: can these coins carve their own path, or are they doomed to follow BTC’s faltering lead? We’re here to champion decentralization and the disruptive power of blockchain, but we’re not ignoring the harsh reality—right now, the market is a mess, and volatility is the only guarantee.
Shiba Inu (SHIB): Triple-Bottom or Triple Trouble?
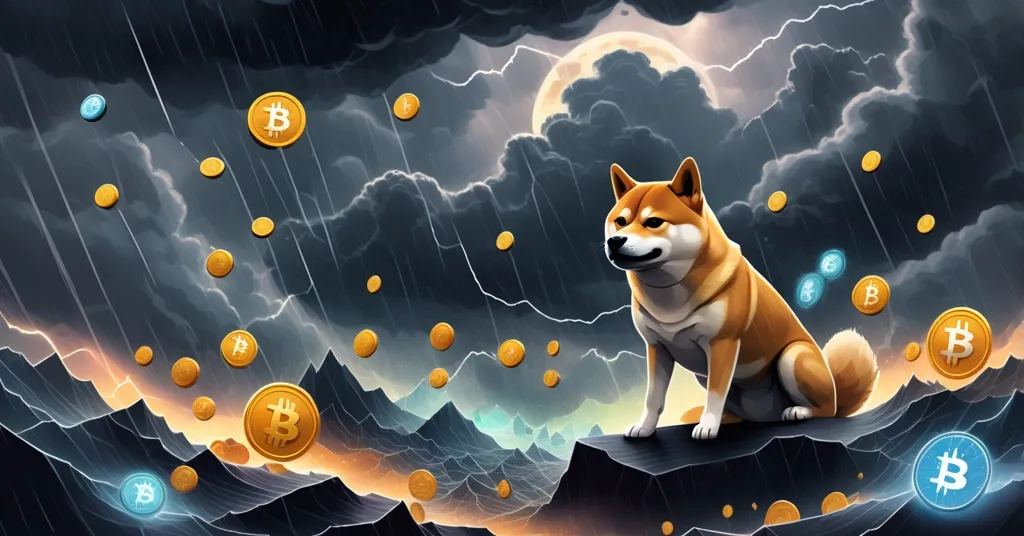
Let’s start with Shiba Inu, the meme coin that’s been a wild ride of hype and heartbreak. Priced at a measly $0.0000099, SHIB is flirting with a key support level of $0.000010. For the uninitiated, a support level is like a shaky floor in the price chart—buyers tend to step in here to prevent further drops, though it’s no ironclad guarantee. SHIB has revisited this low range three times in the past month, sketching out what technical traders call a “triple-bottom pattern.” Picture it as three failed attempts to punch through the floor, often a sign of accumulation (investors quietly stacking coins) or even a reversal if momentum builds. The Relative Strength Index (RSI), a momentum gauge from 0 to 100, sits at 37—close to oversold territory below 30. Think of RSI as a speedometer for price action; near oversold means the asset might be due for a bounce as selling pressure eases.
But let’s not pop the champagne just yet. Resistance levels—price ceilings where sellers often dominate—loom between $0.0000112 and $0.0000131. If the fragile floor at $0.0000095 cracks, we could see a slide to $0.0000088. Trading volume has stabilized since the brutal liquidations of early October’s market crash, but stability isn’t strength. SHIB thrives on community-driven frenzy, much like Dogecoin did during its 2021 moonshot. Without a viral TikTok campaign or a celebrity tweet to reignite the hype train, this “base” might just be a mirage. And honestly, predicting meme coins is like betting on a coin toss—sometimes it lands on edge. Beyond the charts, updates on Shibarium, SHIB’s layer-2 scaling solution, show sluggish adoption, doing little to bolster confidence. For more insights on SHIB’s current standing, check out this detailed analysis of Shiba Inu’s fundamental support. While we root for disruptive tech, let’s be real: SHIB’s value often hinges on memes, not fundamentals.
XRP: Breakout to $3 or Breakdown to $2?
Shifting gears to XRP, tied to Ripple’s cross-border payment network, we’ve got a story with more utility but no less drama. Trading at $2.38, XRP is locked in a narrowing triangle pattern on the charts. For newcomers, this is a setup where price swings tighten over time, like a coiled spring building tension for a sharp move—up or down. The bullish scenario has XRP blasting through resistance at $2.60-$2.70, eyeing a $3 target that would signal renewed momentum. RSI at 39 suggests there’s room for upward movement if buyers return. Yet, the market’s recent caution, fueled by a flash crash and a 50% drop in trading volume, tempers optimism. If support at $2.20 fails, we’re looking at a potential tumble to $2.00 or even $1.70.
Unlike SHIB’s meme chaos, XRP’s trajectory often ties to real-world factors, notably Ripple’s ongoing legal saga with the U.S. Securities and Exchange Commission (SEC). The lawsuit, centered on whether XRP is an unregistered security, has dragged on for years, with recent developments offering mixed signals—a partial victory for Ripple in 2023 hasn’t fully cleared the regulatory cloud. A favorable resolution could spark adoption by financial institutions, pushing prices higher, but continued uncertainty keeps investors skittish. Historically, XRP has seen breakouts from similar triangle patterns, like in late 2020, but today’s muted volume tells a different story. We’re all for disrupting traditional finance with blockchain, but let’s not kid ourselves—claiming XRP’s breakout is “guaranteed” ignores the chaotic nature of crypto. Overconfident predictions are often just noise; tread carefully.
Ethereum (ETH): $3,500 Support and the DeFi Domino Effect
Now to Ethereum, the backbone of decentralized finance (DeFi) and non-fungible tokens (NFTs), currently looking shaky at $3,880. After failing to hold above $4,000, with resistance at $4,200 backed by the 50-day and 100-day moving averages, ETH is staring down a critical support at $3,500. Moving averages, for those new to charts, are trend lines smoothing out price fluctuations over set periods—the 50-day and 100-day act as barriers signaling bearish pressure when prices can’t break through. The $3,500 level aligns with the 200-day moving average, often a marker of long-term trends. If it cracks, we could see further downside to $3,200 or even $3,000. RSI at 40 is neutral but leaning bearish, and declining trading volume hints that buyers are sitting this one out.
Ethereum isn’t just a coin—it’s a platform hosting thousands of projects, from yield farming protocols to digital art marketplaces. A sustained drop below $3,500 could shake confidence in these ecosystems, especially with transaction costs still biting despite layer-2 solutions like Optimism and Arbitrum easing some pain. Compare this to ETH’s bear market low near $1,000 in 2022; holding $3,500 might mirror that resilience, acting as a springboard for another shot at $4,000. But without Bitcoin paving the way, ETH is vulnerable. On the flip side, Ethereum’s ongoing upgrades, like the shift to proof-of-stake via the Merge, continue to push the boundaries of scalable, decentralized tech—a reminder of why we back effective accelerationism. Still, price action lags behind innovation right now, and sentiment is as gloomy as a bear market winter.
Bitcoin’s Flu: A Pandemic for Altcoin Morale
Zooming out, we can’t ignore the elephant in the room: Bitcoin. Its lethargy is more than a minor inconvenience—it’s a full-blown drag on altcoin morale. With BTC struggling to reclaim key levels, likely due to macroeconomic headwinds like high interest rates curbing institutional inflows, the broader market feels the chill. Bitcoin’s dominance, often measured as its share of total crypto market cap, remains high, meaning altcoins rarely thrive when the king stumbles. This correlation isn’t just a theory; it’s a painful reality for SHIB, XRP, and ETH holders watching their portfolios bleed in sync. While we’re Bitcoin maximalists at heart, pushing for its vision of financial freedom and privacy, we recognize altcoins fill crucial niches—Ethereum with smart contracts, XRP with cross-border payments—that BTC doesn’t directly serve. Yet, until Bitcoin shakes off this funk, expecting independent rallies feels like wishful thinking.
Playing Devil’s Advocate: Are We Over-Relying on Charts?
Let’s take a step back and poke at the foundation of all this analysis. Technical indicators like RSI, support levels, and chart patterns—triple-bottoms for SHIB, triangles for XRP—offer a roadmap, but are we putting too much faith in squiggly lines? Crypto’s irrational side often trumps logic. Black swan events, like sudden regulatory crackdowns or major exchange hacks, can render these predictions useless overnight. Sentiment, fueled by social media or whale manipulations, frequently overrides technicals. While we dissect these patterns to inform and drive adoption, remember: no chart predicted the 2018 Mt. Gox collapse or the 2021 Elon Musk Dogecoin tweets. Tools are helpful, but skepticism is your best armor in this wild west of digital assets.
Key Takeaways: Questions to Chew On
- What’s Driving Shiba Inu’s Current Price Action?
SHIB, at $0.0000099, hints at a triple-bottom pattern near $0.000010, suggesting a possible reversal if buyer volume surges—but meme coin volatility means it’s a gamble. - Can XRP Really Hit $3 in This Market?
At $2.38, XRP could target $3 by breaking $2.60-$2.70 resistance, though weak volume and a drop below $2.20 might push it to $2.00 or lower. - Is Ethereum at Risk of a Deeper Sell-Off?
Trading at $3,880, ETH faces a crucial test at $3,500 support; a break could drag prices to $3,200, rattling DeFi and NFT confidence. - Why Does Bitcoin’s Stagnation Hurt Altcoins So Much?
Bitcoin’s failure to recover saps momentum from altcoins like SHIB, XRP, and ETH, amplifying market uncertainty and keeping direction unclear. - Should We Trust Technical Indicators in Crypto?
Tools like RSI and chart patterns provide clues, but crypto’s wild swings and external shocks mean no prediction is foolproof—always question the data.
So, where do we stand? Caught in a holding pattern with more risks than certainties. Shiba Inu might be carving a base, but meme coins are a crapshoot without hype. XRP’s triangle could spark a rally—or a crash—if momentum stays asleep. Ethereum’s $3,500 line is the battlefield, but without Bitcoin leading the charge, optimism feels hollow. We’re passionate about pushing decentralization and disrupting outdated financial systems, yet we can’t ignore the ugly chaos of today’s market. Scammers and shillers are out there peddling fake price targets—don’t swallow their garbage. As we track these levels, a bigger question lingers: will altcoins ever break free from Bitcoin’s shadow, or are we stuck on this synced rollercoaster? Keep your charts close, your skepticism closer, and your portfolio ready for turbulence. We’re here to cut through the noise and drive real adoption, one honest breakdown at a time.