Rare Binance Flow Signal Flashes as Bitcoin Struggles Below $80K
Bitcoin is stuck below $80,000, but a rare Binance exchange flow signal is flashing a setup that has marked major turning points before.
- BTC is trading around $75,000–$77,000 after failing to hold above $80,000.
- Key support sits in the $69,000–$72,000 zone.
- The Bitcoin Fund Flow Ratio on Binance has returned to the 0.010–0.012 range.
- That zone has only appeared six times since 2018, and the last five visits came before major shifts.
- Bitcoin remains below the 50-week moving average near $82,000, while the broader trend is still above the 100-week and 200-week averages.
- Declining volume suggests the rebound attempt lacks real conviction.
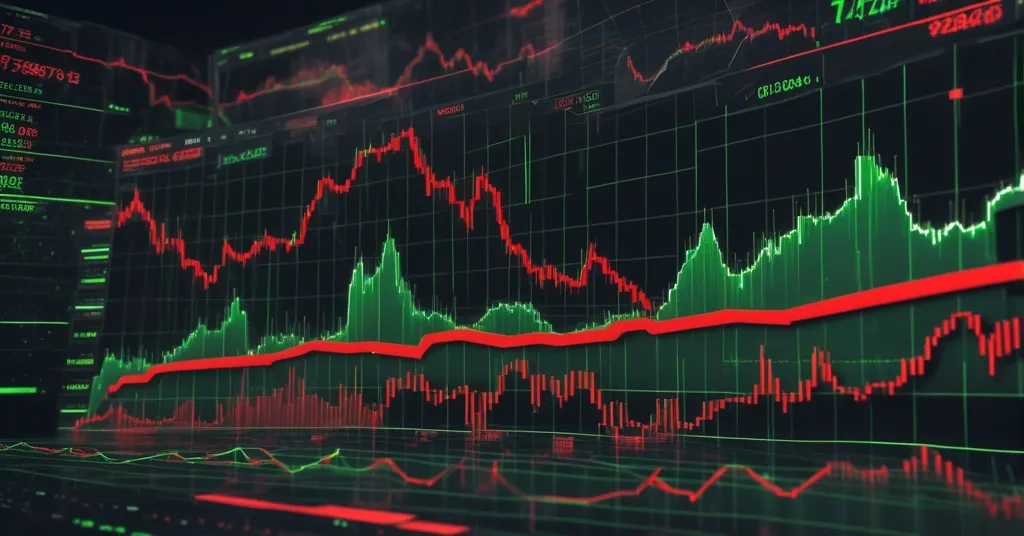
Bitcoin price action is looking awkward, and that’s being generous. After failing to reclaim $80,000 earlier this month, BTC has settled into a tight range above major support while traders try to figure out whether the market is coiling for another leg higher or just running on fumes.
The reason this setup is getting attention is a rare on-chain signal flagged by CryptoQuant analyst MorenoDV. The Bitcoin Fund Flow Ratio on Binance has dropped back into the 0.010 to 0.012 zone for only the sixth time since 2018. That may sound like one more fancy metric with a big name and a chart that looks more confident than it has any right to be, but the historical context is worth a look.
Why this Binance signal matters
The Fund Flow Ratio compares BTC moving through exchanges to the total Bitcoin transferred across the network. Put simply, it measures how much of Bitcoin’s movement is happening on exchanges versus the broader network.
When that ratio is elevated, exchanges are taking a bigger share of network activity. That usually points to more speculation, repositioning, and profit-taking. When the ratio falls into the 0.010–0.012 range, exchange activity has contracted to a small fraction of total transfers. In plain English: less Bitcoin is moving on exchanges.
That can mean different things depending on market conditions. Sometimes it reflects quiet, low-conviction trading. Sometimes it reflects seller exhaustion, where the people most eager to dump BTC have already done so. The signal is interesting, not magical. No metric in crypto prints “buy now, guaranteed,” despite the internet’s tireless commitment to pretending otherwise.
“The Bitcoin Fund Flow Ratio on Binance has returned to the 0.010 to 0.012 zone for the sixth time since 2018.”
“That specific range… has preceded structural turning points in Bitcoin’s price on five previous occasions.”
That phrase, structural turning point, basically means a shift in market behavior that can lead to a new trend. It might be the start of recovery, the launch of a new rally, or the beginning of a deeper breakdown. In other words, it’s a fork in the road, not a prophecy tablet handed down from Mt. Candlestick.
Bitcoin is still trapped between support and resistance
The price chart is not exactly screaming confidence. Bitcoin tried to reclaim $80,000 and got rejected. Since then, it has been consolidating around $75,000–$77,000, which keeps the market in a tense middle ground.
On the downside, the most important support band sits around $69,000–$72,000. That area matters because it’s where buyers have previously stepped in and where a breakdown could invite a much uglier move if it fails.
On the upside, the big level to watch is the 50-week moving average near $82,000. A moving average is just a line that smooths out price action over time, helping traders spot the broader trend instead of getting hypnotized by every random candle wick. The 50-week version is especially watched because it often reflects whether the market is in a healthy uptrend or just pretending to be.
Bitcoin is still above the 100-week and 200-week moving averages, which matters. That means the broader macro trend has weakened, but it has not fully broken. So BTC is not in a full-blown collapse. It’s in that ugly, indecisive phase where both bulls and bears have a case and neither side wants to admit it.
The bull case: low flow could mean sellers are tired
The optimistic read is straightforward. If exchange flow activity is extremely low, it may mean the market has already cleared out a lot of the sellers. That’s the idea behind seller exhaustion — the people most eager to sell are gone, leaving price less exposed to repeated dumps.
In that scenario, compressed exchange activity can act like a pressure cooker. The market gets quieter, volatility narrows, and then a move finally breaks loose. That is why MorenoDV’s note matters: previous visits to this flow zone came before major changes in Bitcoin’s behavior, including the aftermath of the 2018 bear market, the 2019 recovery, and the 2020 bull market expansion.
That does not mean history will repeat perfectly. It never does. But when a signal has shown up only six times in nearly seven years and five of those appearances lined up with meaningful shifts, it deserves more than a lazy shrug.
The bear case: quiet can also mean weak demand
Here’s the part that gets sanded down too often in crypto bullish narratives: low exchange flow does not automatically mean a bottom is in. It can also mean the market is simply sluggish and demand is weak.
That’s where the current price action gets uncomfortable. The rebound attempt has come with declining volume, which suggests buyers are not backing the move with much strength. When price rises without strong volume, the move can fizzle out fast. It’s the market equivalent of making a big announcement and then discovering nobody showed up to the meeting.
That is why this setup remains a two-way street. The low-flow zone could represent genuine apathy and exhaustion, or it could be the calm before another leg down. The metric doesn’t hand out certainty. It hands out a decision point.
“When the ratio is elevated, exchanges are driving a disproportionate share of network activity.”
“When it falls to the 0.010 to 0.012 zone, exchange activity has contracted to a small fraction of total network transfers.”
“The quiet preceded the move.”
That line cuts both ways. Quiet can precede a breakout. Quiet can also precede a breakdown. Markets love ambiguity almost as much as influencers love pretending they don’t understand it.
What would confirm the bullish case?
The clearest bullish confirmation would be a strong reclaim of $82,000, ideally with improving volume. That would put Bitcoin back above the 50-week moving average and suggest the market is not just bouncing, but regaining structure.
Without that reclaim, the current rally attempt remains suspect. BTC can drift higher for a while, but if it cannot recover that major resistance zone with conviction, the move risks being another failed bounce rather than the start of a durable trend.
What happens if support breaks?
If the $69,000–$72,000 support band gives way, the market could slide into a deeper correction. That would not necessarily kill the broader bull structure outright, since Bitcoin is still above the 100-week and 200-week moving averages, but it would seriously damage the short- to medium-term outlook.
That’s the part traders need to respect. Bitcoin is not broken, but it is fragile. It’s holding the line for now, but only just.
“Either the compression reflects genuine apathy… or it reflects sell-side exhaustion creating the foundation from which the next phase builds.”
“It identifies the zone as the decision point where that question gets answered.”
That’s the cleanest way to frame it. The Binance fund flow signal is not a crystal ball. It’s a reminder that Bitcoin is at a sensitive inflection point where the market has to show its hand.
If buyers can reclaim $82,000 and defend that move with real volume, the setup starts leaning bullish. If support cracks first, then the same quiet flow data may end up looking less like accumulation and more like exhaustion before another leg lower.
Key questions and takeaways
What is Bitcoin’s current market condition?
Bitcoin is consolidating around $75,000–$77,000 after failing to hold above $80,000, with momentum weakening and support still under pressure.
What is the Bitcoin Fund Flow Ratio?
It measures BTC flowing through exchanges relative to total BTC transferred across the network. It helps show how much trading activity is centered on exchanges.
Why is the 0.010–0.012 range important?
Because it has appeared only six times since 2018, and the previous five visits came before major shifts in Bitcoin’s price behavior.
Does this signal mean Bitcoin will rally?
No. It could point to seller exhaustion and a base for recovery, but it could also reflect weak demand and a market that is still vulnerable.
What level would strengthen the bullish case?
A clean reclaim of $82,000 and the 50-week moving average, ideally with stronger volume behind the move.
What’s the biggest downside risk?
A loss of the $69,000–$72,000 support zone, which could open the door to a deeper correction.
Is Bitcoin’s broader trend broken?
Not yet. BTC is below major resistance and the 50-week moving average, but it is still above the 100-week and 200-week averages.
Why does volume matter here?
Because the rebound has been happening on declining volume, which suggests buyers are not showing enough conviction to confirm a sustained recovery.
Bitcoin is not confirming a breakout, and it is not confirming a breakdown either. It’s sitting in the awkward middle, where rare on-chain signals, weak volume, and stubborn resistance all point to one thing: the next move should matter.